
Live meter demo: readout, hold, graph and capture
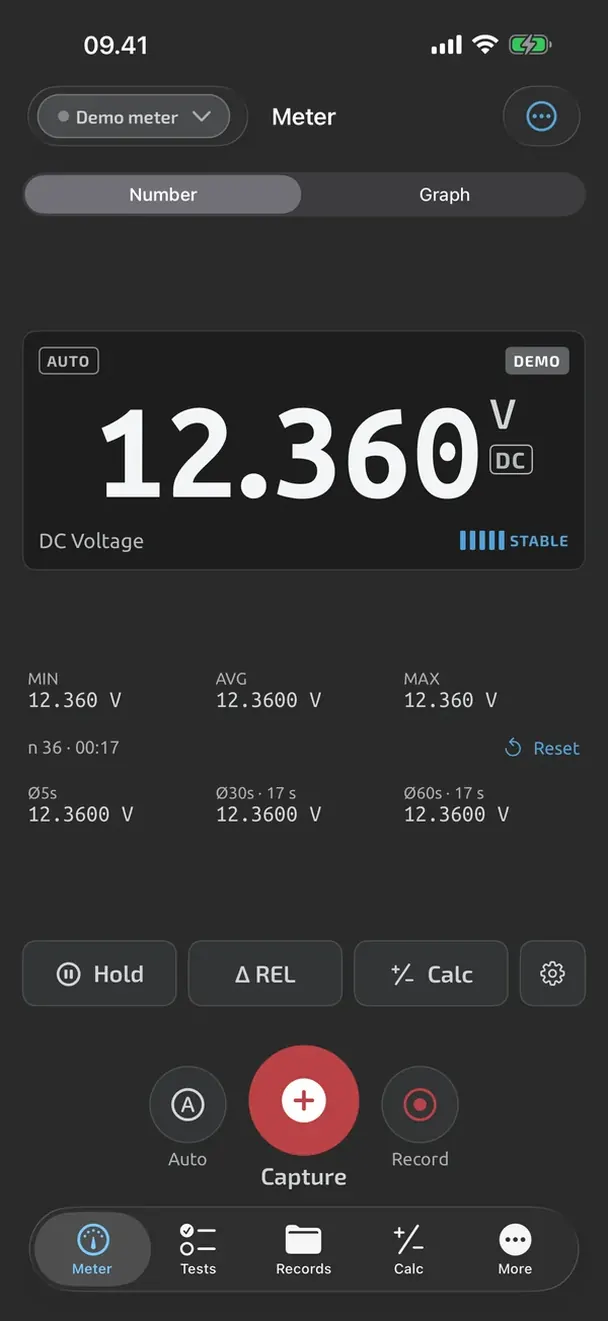
Watch the meter screen of TestNMeasure at work. The readings here are made up; in the app they come from your own multimeter over Bluetooth.
Phone simulation: Live meter
About the live meter
The meter screen shows the reading in large digits with five stability bars that fill as the value settles. Under it are MIN, AVG and MAX and the rolling averages over 5, 30 and 60 seconds. Hold freezes the display while the meter keeps measuring, REL subtracts a reference, and the Graph tab shows the last 30 seconds.
Capture saves the reading with the time and the meter's name in Records; Record logs a series you can export to Excel or CSV.
On testnmeasure.app
- How the live meter works: readout, graph, hold and stats
- Capture, logging and Records
- Guide: log multimeter readings to Excel or CSV
- Guide: log a multimeter overnight
- See the supported OWON and ZOYI meters
- TestNMeasure on the App Store
iPhone and iPad (iOS 17 or later): free on the App Store. Android later.